Jira Data Visualiser
Building tooling to help us to visualise our plans
Introduction
I use Jira extensively, both in my role as Platform Engineering Manager at Cazoo and to plan out my personal hobbies, learning plans, life goals, and admin lists. I find two features in the platform especially helpful, namely:
- The ability to bucket work into epics, and
- The ability to chain stories together using blocking relationships.
I favour a simple Kanban approach to everything I do and so I typically end up with a view like this: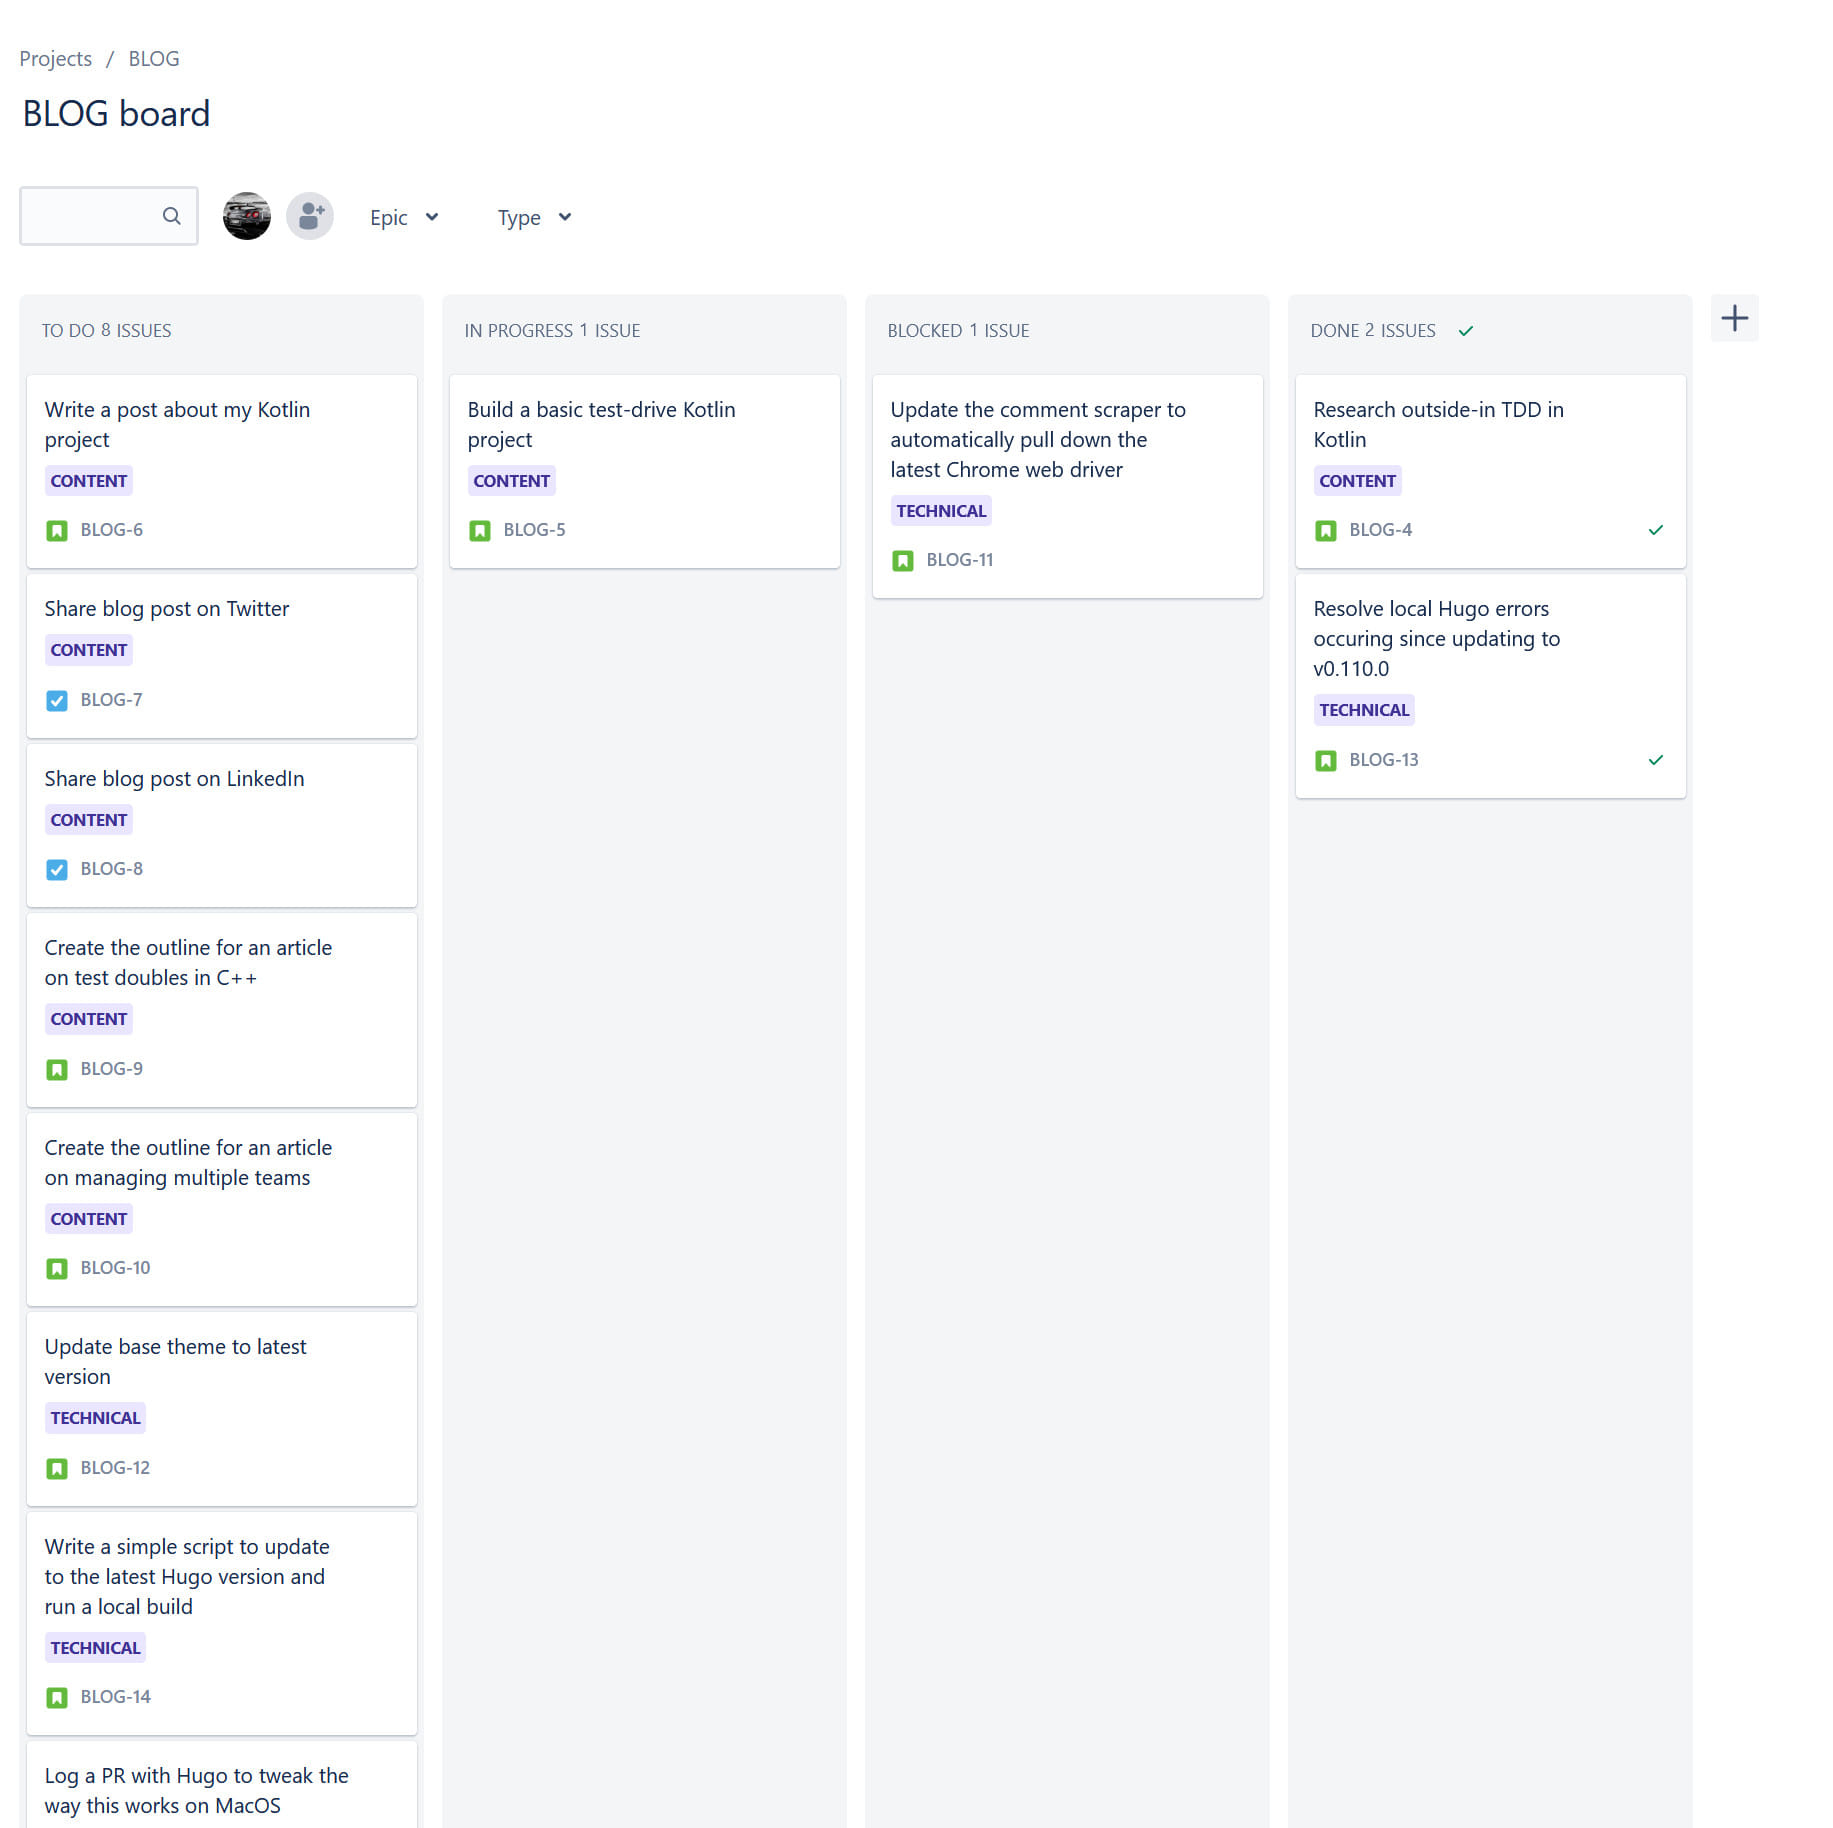
This is useful for tracking the single piece flow, however it doesn’t clearly show the blocking relationships between items. I am particularly interested in these relationships as they help me to think about ordering and prioritisation.
I created the Jira Data Visualiser to solve this problem. It generates diagrams that look like this: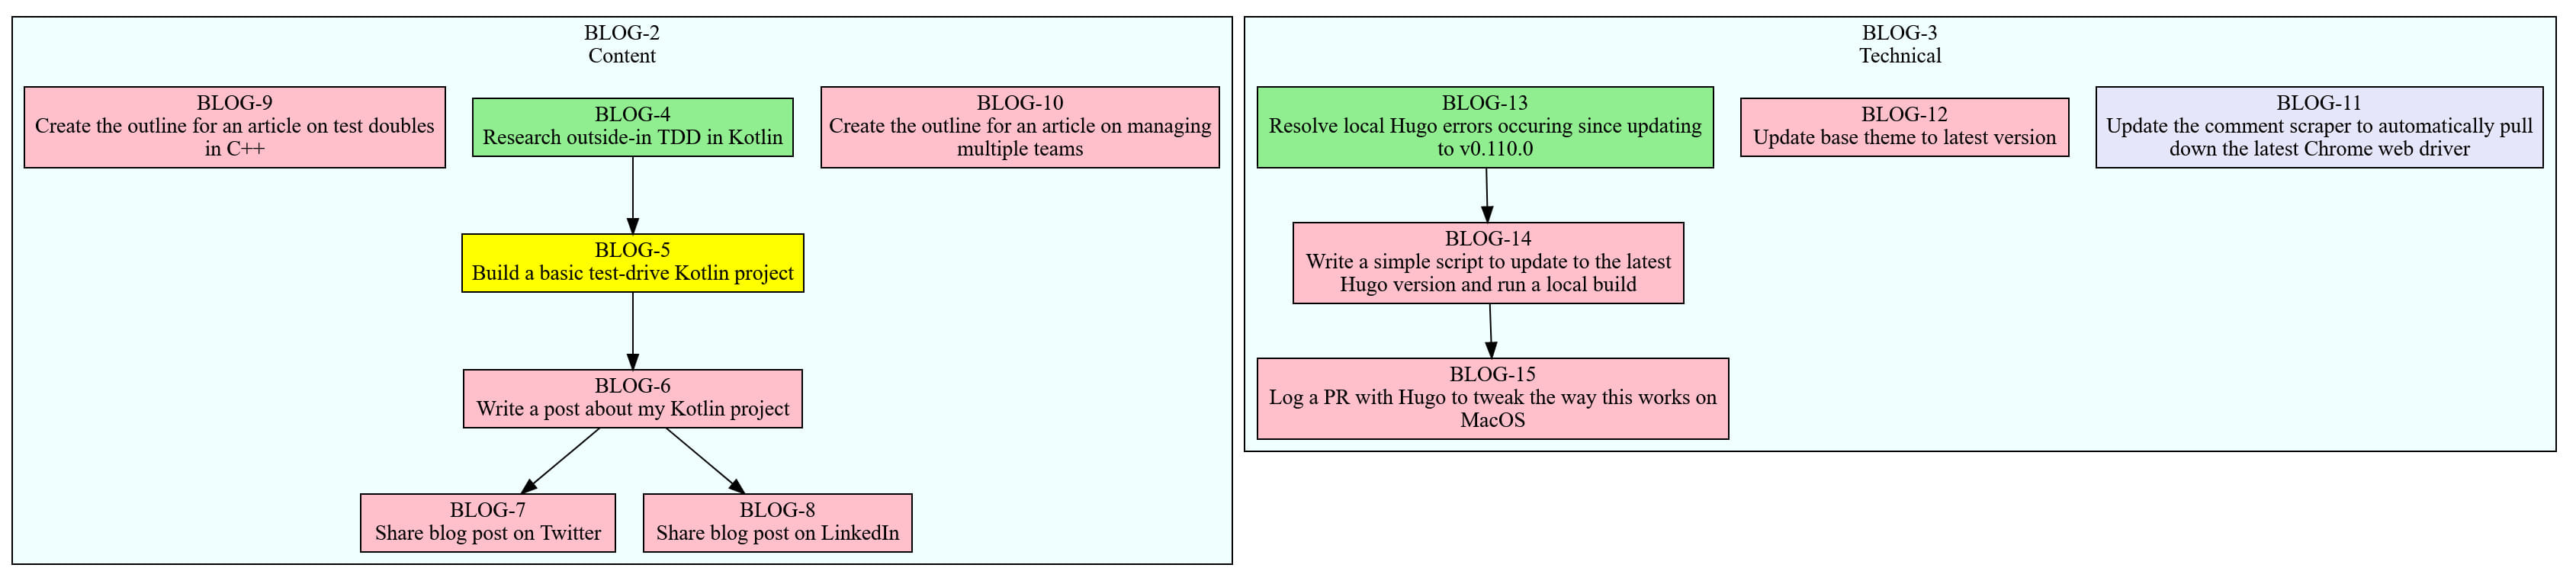
This clearly shows the relationships between dependent items and allows and allows me to plan and execute more effectively.
Benefits Of The Tool
- Helping my team to visualise the flow of their wider objectives.
- Helping my team to plan their week’s work on Monday mornings.
- Splitting initiatives down into buckets that I can easily query using JQL and visualise independently.
- Making sure that I am tackling the most important tasks first in my personal life (AKA eating the frog).
The diagrams this tool generates are SVG files that will open in any major browser. They are generated such that you can click on any issue or epic to open it in a new Jira tab. This makes it really easy to tweak things when you spot areas of the diagrams that need to change.
Why Build My Own Thing?
Two reasons:
- I spent some time with an Agile Coach at Cazoo researching whether there were any free options to do this and we couldn’t find anything.
- It was a fun spare-time project to work on 😁
How Does It Work?
The flow is fairly simple:
- Read a JQL query from the configuration file.
- Execute this query against the JIRA REST API.
- Translate the results into a DOT file.
- Use GraphViz to turn this DOT file into an SVG.
- Open this generated file in the default system viewer for SVG files.
Next Steps
- Although this project was written using a TDD approach, a couple of my unit tests are testing more than one thing which is A Very Bad Thing. This needs to be fixed.
- Some tests are too long and confusing, with walls of raw strings representing JQL inputs and DOT outputs.
- There is a minor off-by-one error on the sentence splitter class which I have accepted as more of an annoyance than a bug.
- I’d also consider cleaning up the configuration file and using some sort of YAML or JSON structure, and pulling out the hardcoded colour scheme into something customisable.
- Finally, it would be cool to get this running inside Jira itself - maybe on the Atlassian Marketplace.
Scott Edwards
Engineering Leader
Engineering leader aligning teams around clear outcomes and scalable delivery